

CO2 measured from soil
Values for GHG emissions in the two croppig systems are updated after the harvest of each crop, or at the end of the bare soil. Periods considered in the measurements are reported under the graphs.
Data are under validation, so the shown results aren’t definitive
Ravenna CCS - Conventional Cropping System [CO2]

Bare soil
Start: 11/12/2019End: 01/04/2019
Duration: 111 days
Cumulated flux: 169.2 ± 14.1 g CO2 m-2
Average daily flux: 1.5 g CO2 m-2
Maize
Sowing: 02/04/2020Harvest: 10/09/2020
Duration: 161 days
Cumulated flux: 992.7 ± 69.0 g CO2 m-2
Average daily flux: 6.2 g CO2 m-2
Yield: 8.8 t ha-1 s.s.
Total biomass: 21.6 t ha-1 s.s.
Fertilisation: 196.6 kg ha-1 N
Irrigation: 75 mm
Treatments: 2 insetticides, 2 herbicides
Crop residues: chopped
Bare soil
Start: 11/09/2020End: 19/10/2020
Duration: 38 days
Cumulated flux: 502.0 ± 41.7 g CO2 m-2
Average daily flux: 14.8 g CO2 m-2
Durum wheat
Sowing: 20/10/2020Harvest: 24/06/2021
Duration: 247 days
Cumulated flux: 975.9 ± 154.1 g CO2 m-2
Average daily flux: 4.0 g CO2 m-2
Yield: 6.8 t ha-1 s.s.
Total biomass: 16.2 t ha-1 s.s.
Fertilisation: 180.4 kg ha-1 N
Treatments: 1 fungicide, 1 herbicied
Crop residues: removed
Bare soil
Start: 25/06/2021End: 16/05/2022
Duration: 325 days
Cumulated flux: 1276.3 ± 149.2 g CO2 m-2
Average daily flux: 3.9 g CO2 m-2
Tomato
Start: 17/05/2022End: 27/08/2022
Duration: 102 days
Cumulated flux: 1219.6 ± 271.2 g CO2 m-2
Average daily flux: 12.6 g CO2 m-2
Yield: 6.3 t ha-1 d.m.
Total biomass: 12.9 t ha-1 d.m.
Fertilisation: 140.1 kg ha-1 N, 100.2 kg ha-1 P2O5, 137.8 kg ha-1 K2O
Irrigation: 389 mm
Treatments: 1 insecticide, 3 herbicide, 10 fungicide
Residues: buried
Bare soil
Start: 28/08/2022End: 24/10/2022
Duration: 57 days
Cumulated flux: 263.4 ± 28.2 g CO2 m-2
Average daily flux: 15.5 g CO2 m-2
Durum wheat
Start: 25/10/2022End: 26/06/2023
Duration: 244 days
Cumulated flux: 1348.2 ± 166.4 g CO2 m-2
Average daily flux: 7.1 g CO2 m-2
Yield: 4.35 t ha-1 d.m.
Fertilisation: 115.5 kg ha-1 N
Treatments: 1 fungicide, 1 insetticide, 1 herbicide
Residues: removed
From 11/12/2019 to 26/06/2023 the CO2 cumulated flux measured in the CCS cropping system in Ravenna is 6747.6 g CO2 m-2
Ravenna ECS – Efficient Cropping System [CO2]

Pea
Sowing: 11/12/2019Harvest:19/06/2020
Duration: 191 days
Cumulated flux: 370.1 ± 44.8 g CO2 m-2
Average daily flux: 1.9 g CO2 m-2
Yield: 4.0 t ha-1 s.s.
Total biomass: 8.3 t ha-1 s.s.
Irrigation: 25 mm
Treatments: 1 herbicide
Crop residues: chopped
Bare soil
Start: 20/06/2020End: 19/10/2020
Duration: 121 days
Cumulated flux: 664.9 ± 91.5 g CO2 m-2
Daily average flux: 5.4 g CO2 m-2
Durum wheat
Sowing: 20/10/2020Harvest: 24/06/2021
Duration: 247 days
Cumulated flux: 671.2 ± 40.8 g CO2 m-2
Average daily flux: 2.7 g CO2 m-2
Yield: 7.4 t ha-1 s.s.
Total biomass: 16.4 t ha-1 s.s.
Fertilisation: 130.0 kg ha-1 N
Irrigation: 75 mm
Treatments: 1 fungicide
Crop residues: removed
Alfalfa
Start: 25/06/2021End: 05/10/2021
Duration: 102 days
Cumulated flux: 309.7 ± 96.7 g CO2 m-2
Average daily flux: 3.1 g CO2 m-2
Total biomass: 0.4 t ha-1 s.s.
Bare soil
Start: 06/10/2021End: 16/05/2022
Duration: 222 days
Cumulated flux: 495.9 ± 17.0 g CO2 m-2
Average daily flux: 2.2 g CO2 m-2
Tomato
Start: 17/05/2022End: 27/08/2022
Duration: 102 days
Cumulated flux: 1003.8 ± 193.5 g CO2 m-2
Average daily flux: 10.3 g CO2 m-2
Yield: 5.7 t ha-1 d.m.
Total biomass: 11.2 t ha-1 d.m.
Fertilisation: 109.3 kg ha-1 N, 101.8 kg ha-1 P2O5, 135.6 kg ha-1 K2O
Irrigation: 311 mm
Treatments: 1 insecticide, 3 herbicide, 9 fungicide
Residues: buried
Bare soil
Start: 28/08/2022End: 24/10/2022
Duration: 57 days
Cumulated flux: 101.4 ± 4.5 g CO2 m-2
Average daily flux: 6.0 g CO2 m-2
Durum wheat
Start: 25/10/2022End: 26/06/2023
Duration: 244 days
Cumulated flux: 1835.9 ± 187.8 g CO2 m-2
Average daily flux: 9.7 g CO2 m-2
Yield: 4.35 t ha-1 d.m.
Fertilisation: 156 kg ha-1 N
Treatments: 1 fungicide, 1 herbicide
Residues: removed
From 11/12/2019 to 26/06/2023 the CO2 cumulated flux measured in the ECS cropping system in Ravenna is 5452.9 g CO2 m-2
Foggia CCS - Conventional Cropping System [CO2]

Bare soil
Start: 28/11/2019End: 30/04/2020
Duration: 154 days
Cumulated flux: 213.8 ± 31.9 g CO2 m-2
Average daily flux: 1.4 g CO2 m-2
Sunflower
Sowing: 30/04/2020Harvest: 17/09/2020
Duration: 140 days
Cumulated flux: 628.0 ± 93.2 g CO2 m-2
Average daily flux: 4.4 g CO2 m-2
Yield: 0.4 t ha-1 s.s.
Total biomass: 0.6 t ha-1 s.s.
Fertilisation: 56 kg ha-1 N
Irrigation: 30 mm
Crop residues: chopped
Bare soil
Start: 18/09/2020End: 30/11/2020
Duration: 73 days
Cumulated flux: 104.2 ± 12.5 g CO2 m-2
Average daily flux: 1.7 g CO2 m-2
Durum wheat
Sowing: 01/12/2020Harvest: 24/06/2021
Duration: 205 days
Cumulated flux: 446.7 ± 50.5 g CO2 m-2
Average daily flux: 2.4 g CO2 m-2
Yield: 2.9 t ha-1 s.s.
Total biomass: 10.57 t ha-1 s.s.
Fertilisation: 222 kg ha-1 N + 30 kg ha-1 P2O5
Treatements: 2 fungicide
Crop residues: removed
Bare soil
Start: 25/06/2021End: 21/12/2021
Duration: 179 days
Cumulated flux: 390.9 ± 13.5 g CO2 m-2
Average daily flux: 2.27 g CO2 m-2
Barley
Start: 22/12/2021End: 30/06/2022
Duration: 190 days
Cumulated flux: 446.2 ± 31.6 g CO2 m-2
Average daily flux: 3.6 g CO2 m-2
Yield: 5.84 t ha-1 d.m.
Total biomass: 12.74 t ha-1 d.m.
Fertilisation: 109 kg ha-1 N + 40 kg ha-1 P2O5
Treatments: 1 fungicide
Crop residues: removed
Bare soil
Start: 01/07/2022End: 31/10/2022
Duration: 122 days
Cumulated flux: 289.0 ± 31.4 g CO2 m-2
Average daily flux: 6.02 g CO2 m-2
From 28/11/2019 to 31/10/2022 the CO2 cumulated flux measured in the CCS cropping system in Foggia is 2518.8 g CO2 m-2
Foggia ECS – Efficient Cropping System [CO2]
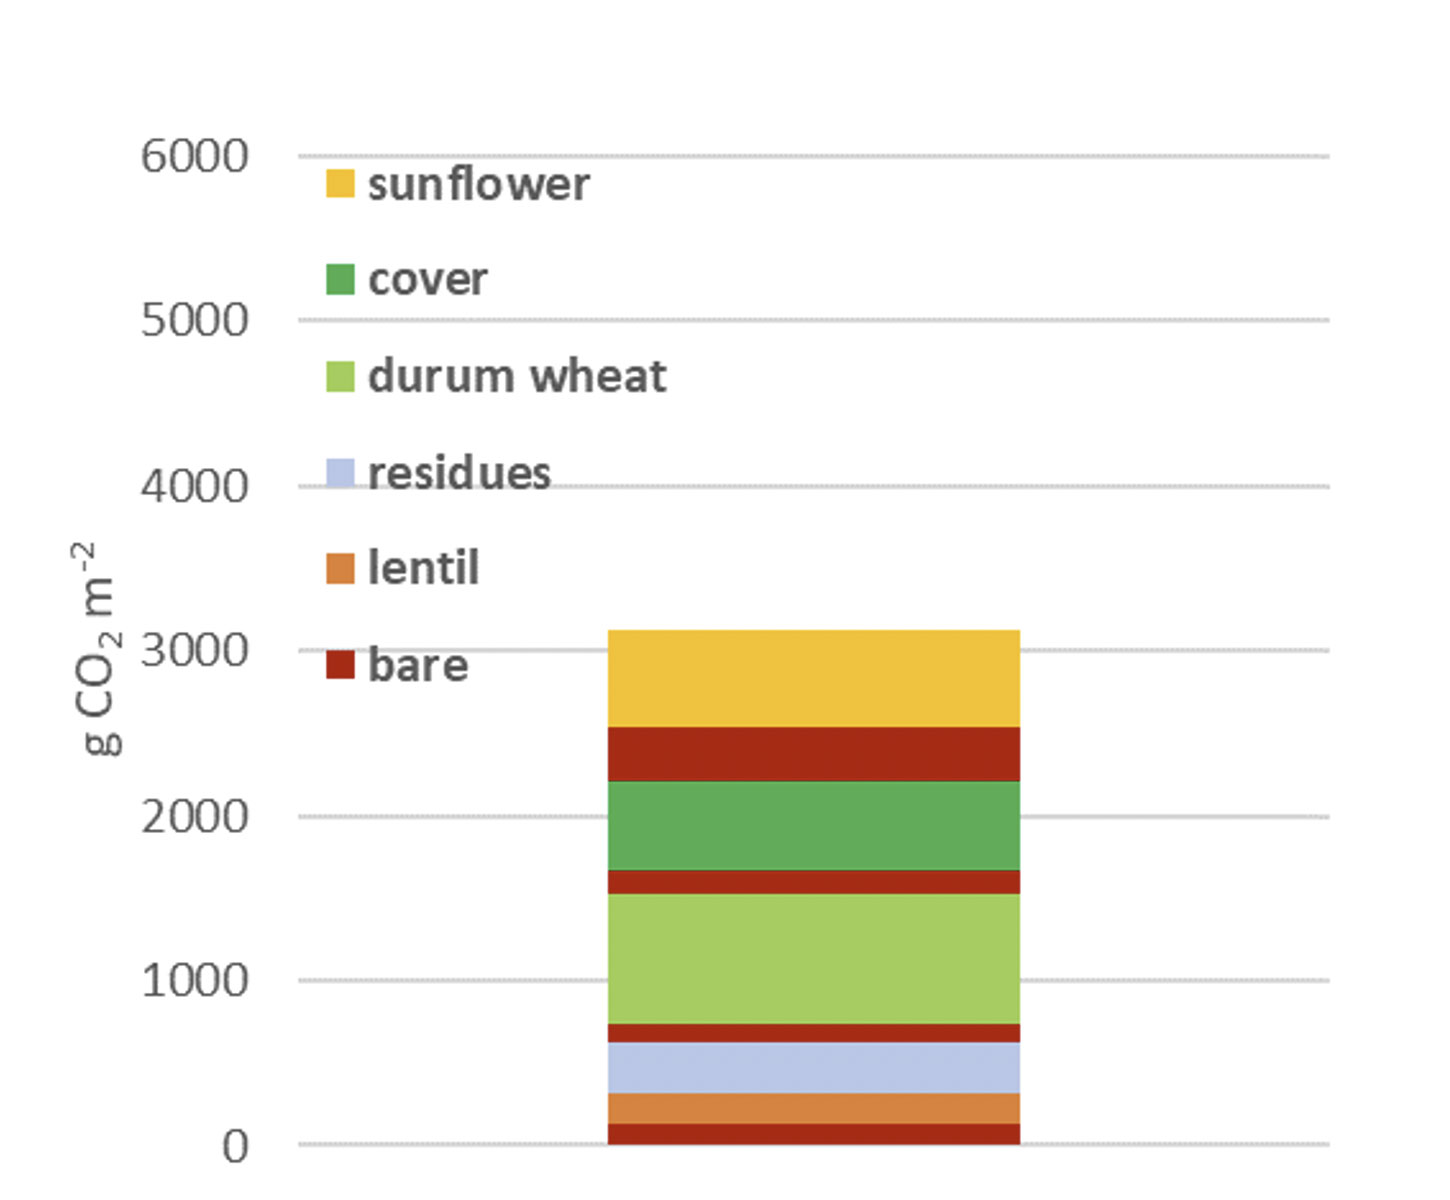
Bare soil
Start: 28/11/2019End: 17/02/2020
Duration: 81 days
Cumulated flux: 128.0 ± 21.5 g CO2 m-2
Average daily flux: 1.6 g CO2 m-2
Lentil
Sowing: 18/02/2020Harvest: 29/06/2020
Duration: 132 days
Cumulated flux: 195.4 ± 24.3 g CO2 m-2
Average daily flux: 1.5 g CO2 m-2
Yield: 0.2 t ha-1 s.s.
Total biomass: 0.5 t ha-1 s.s.
Irrigation: 30 mm
Treatements: 2 herbicide
Crop residues: on superface
Crop residues
Start: 30/06/2020End: 21/09/2020
Duration: 83 days
Cumulated flux: 303.5 ± 65.6 g CO2 m-2
Average daily flux: 3.6 g CO2 m-2
Bare soil
Start: 22/09/2020End: 30/11/2020
Duration: 69 days
Cumulated flux: 112.0 ± 5.9 g CO2 m-2
Average daily flux: 1.9 g CO2 m-2
Durum wheat
Sowing: 01/12/2020Harvest: 24/06/2021
Duration: 205 days
Cumulated flux: 792.9 ± 108.2 g CO2 m-2
Average daily flux: 4.3 g CO2 m-2
Yield: 4.3 t ha-1 s.s.
Total biomass: 9.8 t ha-1 s.s.
Fertilisation: 98 kg ha-1 N + 35 kg ha-1 P2O5
Treatements: 1 fungicide
Crop residues: removed
Bare soil
Start: 25/06/2021End: 03/10/2021
Duration: 100 days
Cumulated flux: 140.2 ± 27.8 g CO2 m-2
Average daily flux: 1.6 g CO2 m-2
Mustard
Start: 04/10/2021End: 16/01/2022
Duration: 104 days
Cumulated flux: 536.8 ± 84.9 g CO2 m-2
Average daily flux: 5.2 g CO2 m-2
Total biomass: 3.77 t ha-1 d.m.
Crop was incorporated in soil
Bare soil
Start: 17/01/2022End: 20/04/2022
Duration: 93 days
Cumulated flux: 330.8 ± 19.3 g CO2 m-2
Average daily flux: 3.7 g CO2 m-2
Sunflower
Start: 21/04/2022End: 22/09/2022
Duration: 154 days
Cumulated flux: 386.9 ± 69.3 g CO2 m-2
Average daily flux: 4.8 g CO2 m-2
Yield: 1.7 t ha-1 d.m.
Total biomass: 42.4 t ha-1 d.m.
Fertilisation: 33.5 kg ha-1 N
Treatments: 2 herbicide
Residues: buried
From 28/11/2019 to 22/09/2022 the CO2 cumulated flux measured in the ECS cropping system in Foggia is 3122.6 g CO2 m-2